summaries
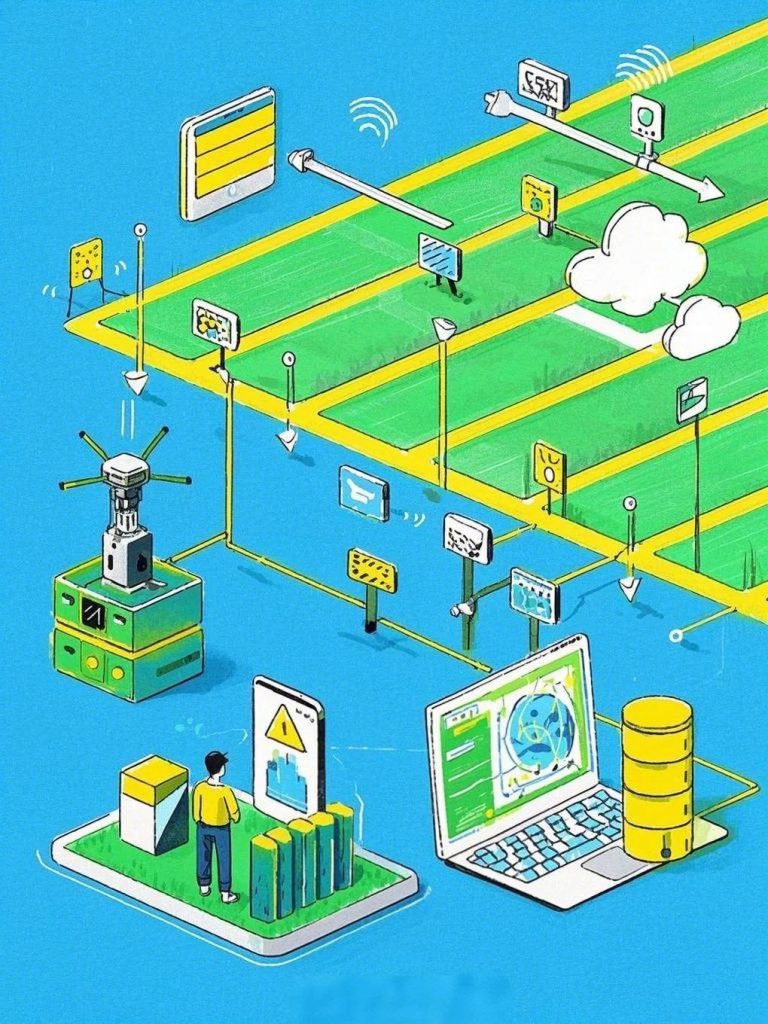
The real-time farmland monitoring system integrates multi-source sensing and Internet of Things (IoT) technologies to realize dynamic collection and precise management of crop growth and environmental data. This paper is based onstar views."Multi-spectral camera + LiDAR + scientific observation in one shot"As an example.It describes its technical architecture, functions and application value, verifies its scientificity with cases, and provides references for agricultural precision management and sustainable development.
I. Concepts and needs for a real-time monitoring system for agricultural land
Real-time farmland monitoring system(Farmland Real-time Monitoring System, FRMS) is based on modern sensing technology, real-time access to multi-dimensional data such as crop growth, soil environment, meteorology, etc., and combines the data analysis model to realize accurate judgment of agricultural conditions. Its core objectives:
1. dynamic perception: Breaking through the limitations of manual observation and realizing the continuous collection of farmland data;
2. accurate diagnosis: Multi-parameter fusion analysis to identify crop stresses (e.g., drought, pests and diseases);
3. scientific decision-making: To support water and fertilizer management, disaster early warning, yield forecasting, and optimizing resource use.
Traditional agricultural monitoring techniquesrestrictIn a single parameter, low resolution and artificial dependence, it is difficult to meet the needs of modern agriculture. Integrated multi-spectral imaging, LiDAR and IoT technology comprehensive monitoring system, become the industry to upgrade thecruxPath.
II. Technical system and core components
2.1 multispectral imaging technology
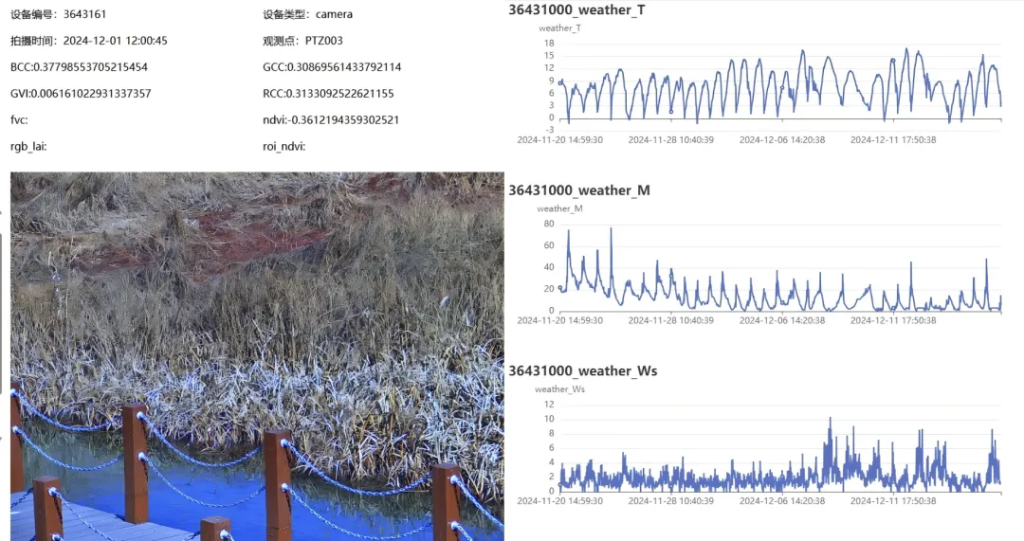
Developed by StarViewXST-PhotoNet Seriesmultispectral cameraThrough synergistic multi-band observations.BreakthroughSpectral limitations of RGB cameras(math.) genusSupporting the analysis of vegetation indices (NDVI, GCC, etc.) and phenological period dynamics::
- dual mode imaging: Standard RGB images (Mode-1) were combined with narrow-band spectral images (Mode-2) to capture chlorophyll absorption features in the 650±10 nm red band, and to resolve canopy structure in the 850±10 nm near-infrared band;
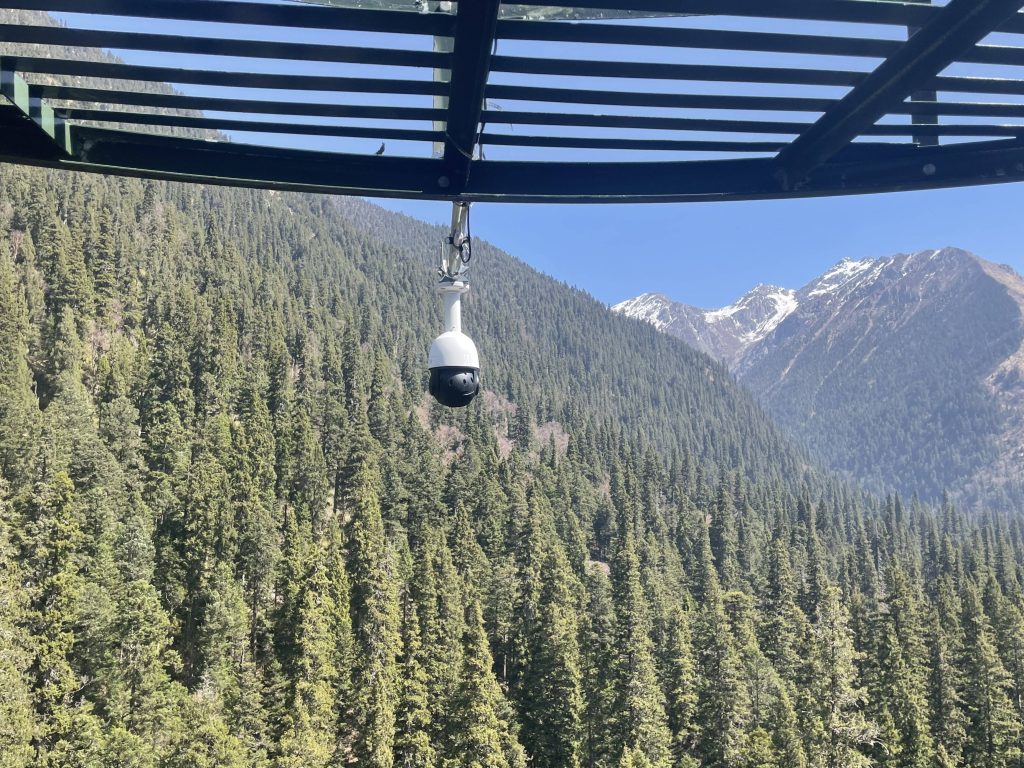
- high spatial and temporal resolution: Hourly continuous observation (5:00-20:00), combined with a 20x optical zoom head, supports group-individual-organ multi-scale monitoring;
- Vegetation index optimization: Calculate 25 indices (e.g., EXG, NDVI) based on 5-band narrowband data, with an accuracy improvement of more than 301 TP3T over broadband data.
application scenario::Crop development period tracking (e.g.Winter wheat in Hebei and Henan(Climate monitoring),Stress response analysis (e.g., alfalfa harvesting and snowfall events at Qingyang station)(NDVI anomaly detection)The
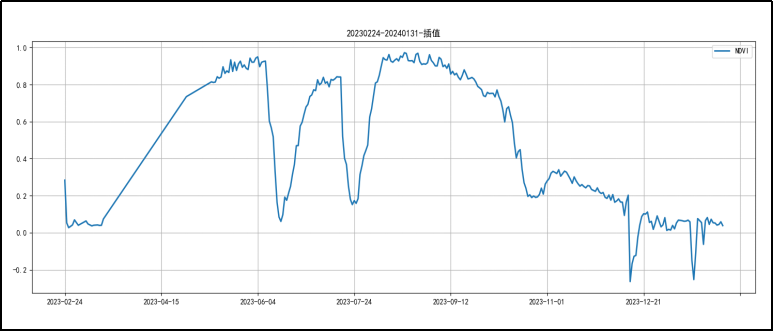
Growing season variation curve of alfalfa NDVI at Qingyang station
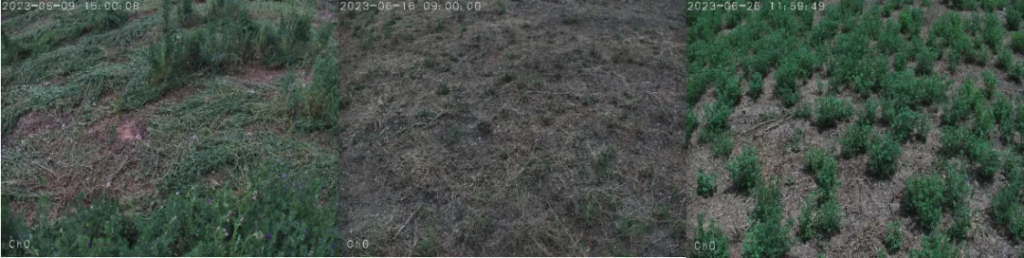
Fluctuations in NDVI due to alfalfa harvest: first crop started on June 9, second crop in late July, third crop in late October
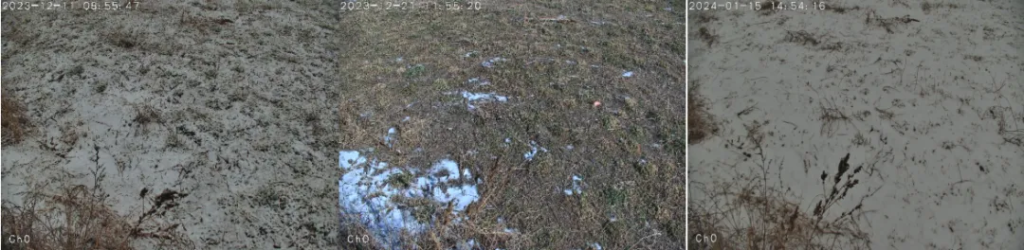
Snowfall induced NDVI fluctuations: snow began to fall on December 11 and largely melted by the 21st; snow fell again on January 15 of the following year
2.2 In-situ LIDAR technology
XST-LiDARNet in situ eco-lidarpass (a bill or inspection etc)Active 3D point cloud scanning(math.) genusBreaking the bottleneck of canopy penetration in passive optical sensors::
- Point cloud processing algorithms: Achieve vegetation-ground separation based on a non-growing season ground reference library to extract parameters such as canopy height, percent cover (FVC), and leaf area body density (LAI);
- Dynamic monitoring capacity: One scan per day (452,000 points/second), supporting analysis of daily changes in vegetation volume (case of monitoring changes in pasture volume in Inner Mongolia grasslands);
- anti-interference design: IP66 protection grade, adapting to -40℃~85℃ extreme environment, suitable for farmland, forest, grassland and other multi-scenarios;
- Technical Advantages: LAI inversion error <101 TP3T, and coverage calculations agree with maize growth rhythms up to 951 TP3T.
application scenario: LIDAR applied to vegetation location monitoring can acquire three-dimensional structure information of vegetation for a long period of time, and get the time series variation of height, volume and other parameters.
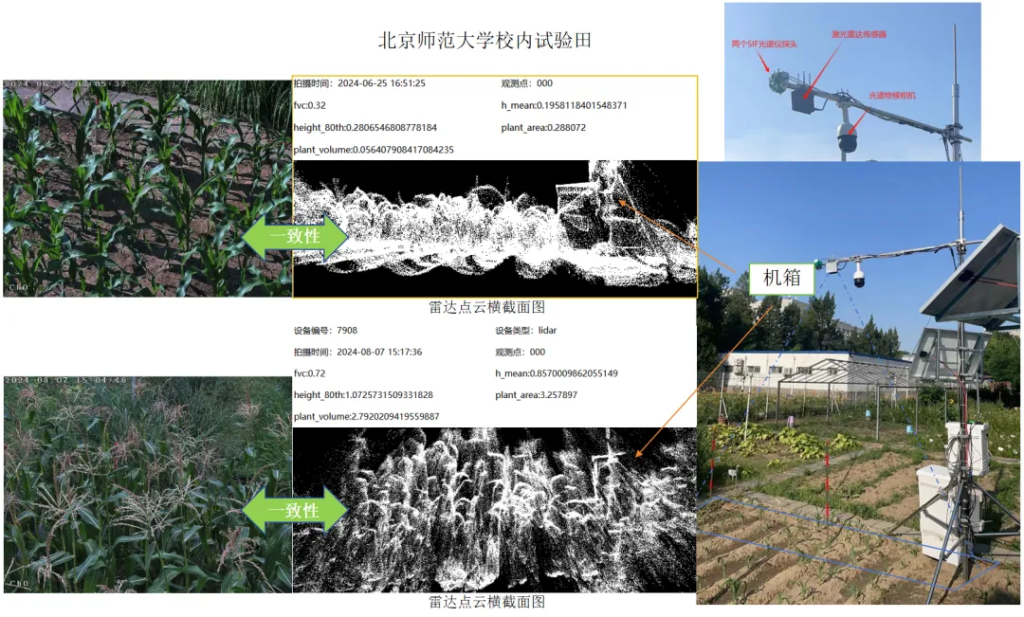
Comparative consistency of combined LiDAR (point cloud) and weather camera (live view) systems
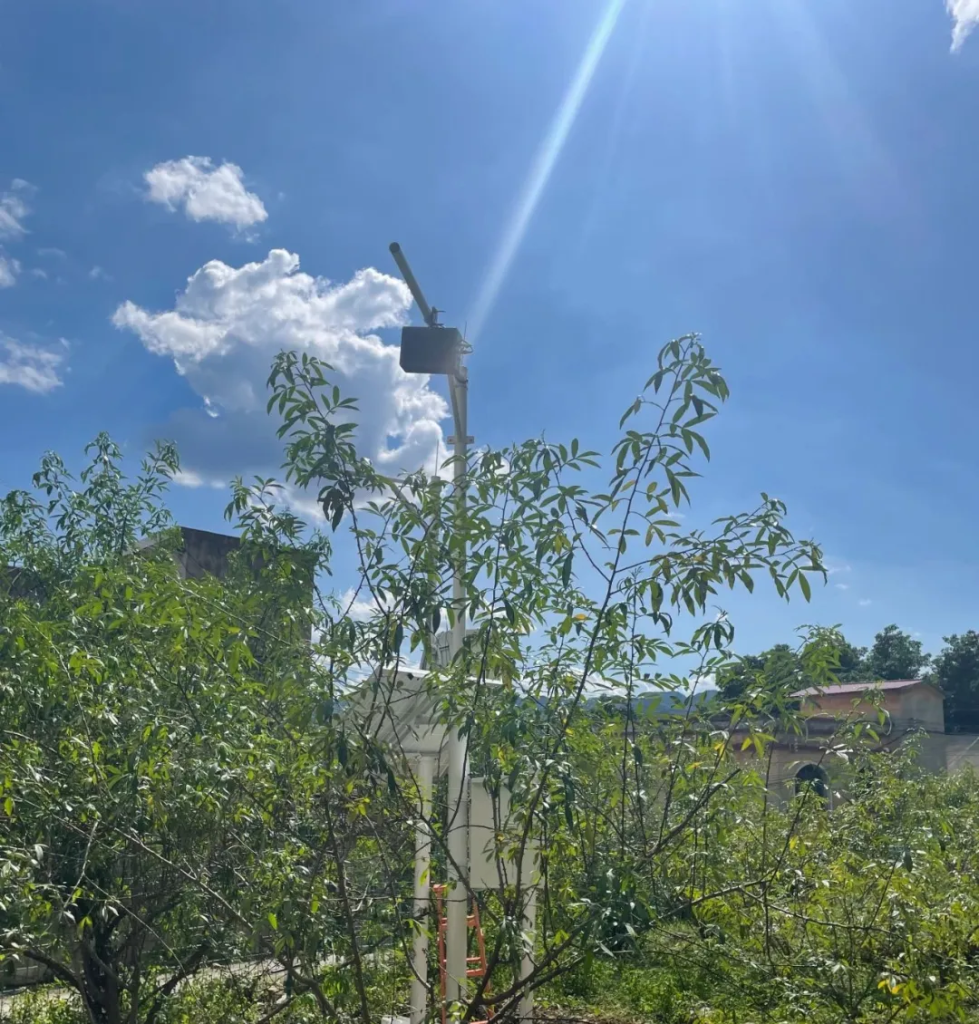
2.3 Multi-source synergistic monitoring platform:XST-SCI-in-Oneone-stop shopping for scientific research and observation
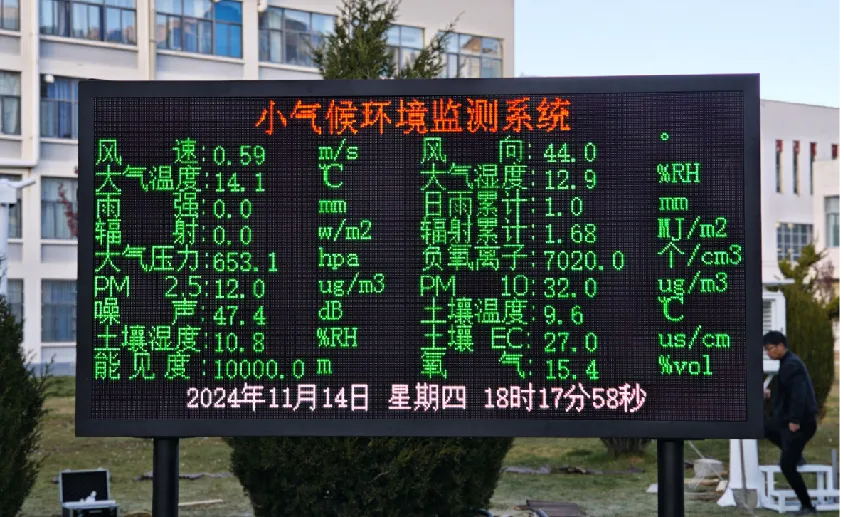
surrounding environmentIntegration of spectral imaging, lidar, weather and soil sensing modules(math.) genusrealization"Environment-crop" synergistic monitoring::
- Four-dimensional data fusion::Multimodal data fusion to greatly improve the robustness and accuracy of model data;
- Plant Ontology Parameters: Vegetation indices such as NDVI, LAI, and FVC;
- meteorological element: Temperature and humidity, wind speed, rainfall, solar radiation (accuracy ±0.2°C/±2%);
- Soil parameters: Temperature/humidity/salt multi-depth monitoring (resolution 0.1°C/0.03%);
- Hydrological data: Radar flow rate sensors (1 mm/s accuracy) support irrigation optimization.
- Edge Computing and Transport: Intelligent data collector (256M memory) processes data in real time and supports255individual sensor access with full 4G transmission;
- data securityLocal-Cloud dual backup, intermittent transfer and exception alarm (SMS/email notification).
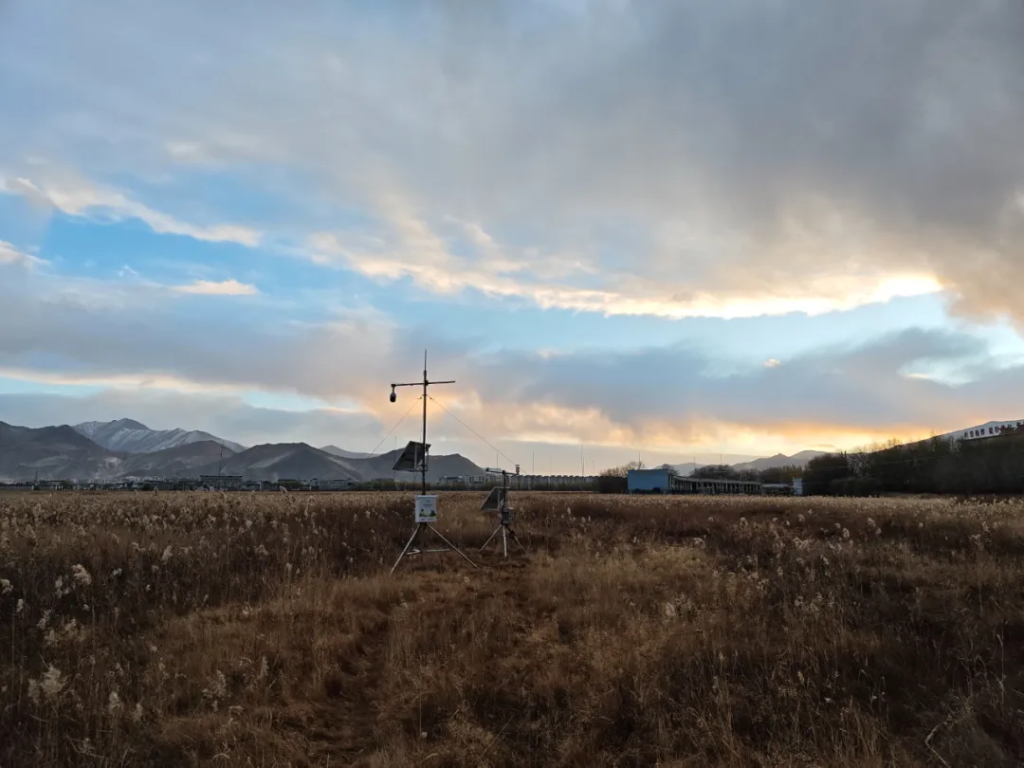
application scenario: IoT cloud data with outdoor real-time playback data.
III. Application value and case studies
3.1 Precision agricultural management
-Fertilizer optimization: Combine soil moisture with canopy LAI data to dynamically adjust irrigation (e.g., alfalfa case at Qingyang Station);
-Pest and disease early warning: Detection of canopy temperature anomalies by thermal imaging module (XST-PhotoNet-TI) to detect stress earlier than the naked eye.
3.2 Disaster response and insurance assessment
-Meteorological disaster warning: Real-time wind speed/rainfall monitoring combined with canopy structure data to assess the risk of collapse (e.g., Inner Mongolia grassland case);
-Quantification of damage: Lidar point cloud reconstruction of 3D model of the affected area to accurately calculate the percentage of yield reduction.
3.3 Remote Sensing Ground Verification and Carbon Sink Accounting
-Synergy between heaven and earth: Joint calibration of multispectral data with satellite remote sensing (e.g., China Carbon Satellite) to improve the accuracy of regional-scale parameter inversion;
-Carbon flux estimation:SIFNet chlorophyll fluorescence data (accuracy ±2%) underpin photosynthesis modeling and aid dual-carbon goals.
IV. Challenges and future prospects
1.technological bottleneck: The complexity of multi-source data fusion algorithms is high, and they need to be combined with AI models (e.g., deep learning) to improve analysis efficiency;
2.cost control: Lidar and hyperspectral equipment are expensive and need to be designed modularly to reduce the cost of deployment at scale;
3.standardized construction: Promote the standardization of monitoring parameters, data formats and interface protocols, and promote multi-platform interoperability.
pendingWith the deep integration of low-altitude UAV remote sensing, digital twin technology and large agricultural models, the farmland monitoring system will evolve towards the integration of "air-sky-earth" and the closed-loop direction of prediction-decision-execution, providing a technological cornerstone for global food security and ecological sustainability. StarView will continue to contribute to this endeavor.
Comments are closed