I. Background of the study
1. Near-Earth remote sensing observation techniques
In the fifth edition of Introduction to Remote Sensing, Introduction to Remote Sensing, a review of theremotely sensedThere is a clear definition: the technology of obtaining information about the earth's surface through electromagnetic radiation emitted or reflected from the earth's surface.
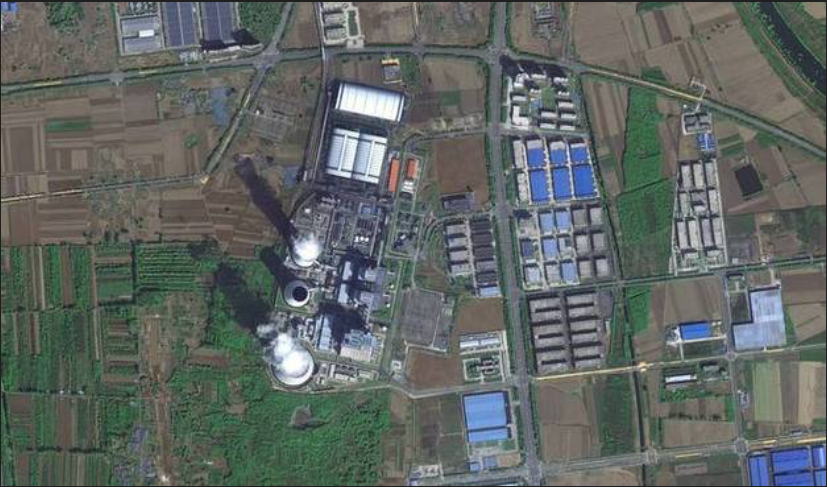
Figure 1.1 Remote Sensing Image
Near-ground remote sensing: detecting spectral information of ground objects within 50m from the ground using optical sensors mounted on masts or towers (Richardson et al., 2013). In Yin Zhan'e's Introduction to Modern Remote Sensing, the concept of ground-based remote sensing is clarified: remote sensing where the platform is at or near the ground, and ground-based platforms include tripods, remote sensing vehicles, remote sensing towers, and ships.
According to the above introduction, it can be learned that the main body of the equipment is an optical (radiological) sensor that can emit or receive electromagnetic waves and can process these electromagnetic wave signals to extract useful surface information; the operating platform of the sensor has fixed platforms such as pylons and tripods as well as mobile platforms such as unmanned aerial vehicles and remote sensing vehicles.
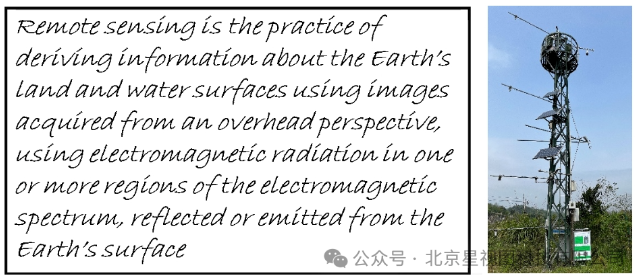
Figure 1.2
2,The concept of climate
Phenology, as the name implies, is "biological time": the observation of the time of day when the phenomena of growth and development of plants and animals occur. Phenology is a sub-discipline of biology, which is the science of the interrelationships between plants and animals in the natural world and the environmental conditions (climate, hydrology, soil, etc.) that change periodically. For thousands of years, working people have paid attention to the relationship between natural phenomena such as the prosperity of plants and trees, the arrival and departure of migratory birds and the climate, so as to organize agricultural activities accordingly. For example, most of the 24 solar terms in China are described or even named directly after climatic phenomena, such as hibernation, grain rain and mango seeding.
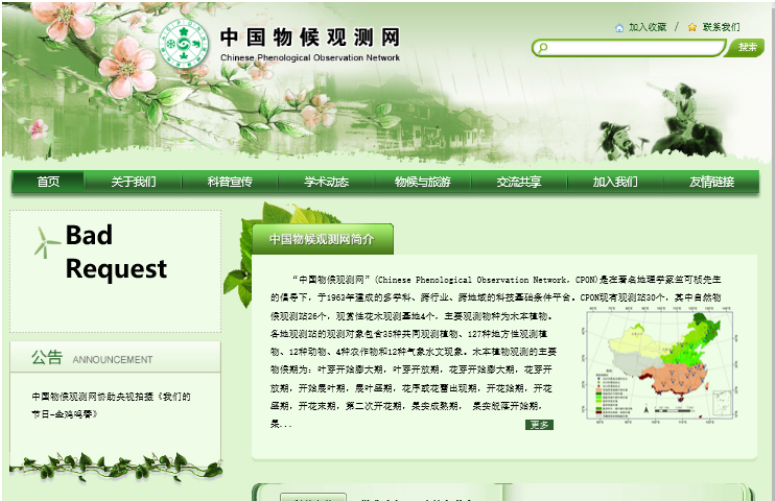
Figure 1.3 China Climate Observation Network
3,Concept of vegetation index
Spectral combinations capable of characterizing vegetation. The purpose of using vegetation indices is to highlight the characteristics of the vegetation and to facilitate the quick identification (extraction) of parameters such as vegetation structure, growth, health, etc. in spectral curves or images. Common vegetation indices: GCC Relative Greenness Index, NDVI Normalized Vegetation Index (NDVI), with the following formulas:
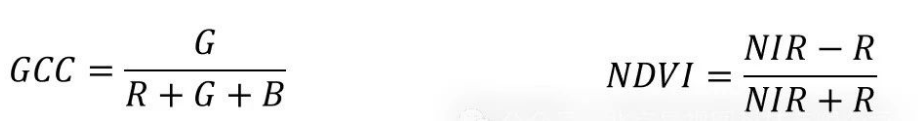
Figure 1.4 Vegetation index
4,Relationship between phenology and vegetation indices
Vegetation indices can well reflect the growth status and health of vegetation, so vegetation indices (e.g. NDVI) are usually used as a quantitative index of plant phenology. Long-term continuous observation of vegetation index can obtain the trend of plant growth over time and the time nodes of the phenological period.
5,Measurement of plant phenology in near-Earth remote sensing methods
Plant climate needs to be observed continuously for a long period of time, so instruments based on stationary platforms are needed. Climate camera is the mainstream instrument to monitor plant climate: compared with the early artificial climate observation method, it has less labor cost and less environmental interference; it can realize automatic observation, remote data transmission and other functions, and it can extract various vegetation indices through algorithms, which can be used as climate indicators. Early climate cameras were ordinary RGB color cameras, which could be extended to obtain a series of broad-band vegetation indices such as GCC, RCC, BCC, GVI, etc., while taking pictures at regular intervals to obtain time-series color pictures; these indices were often used in the early climate research.
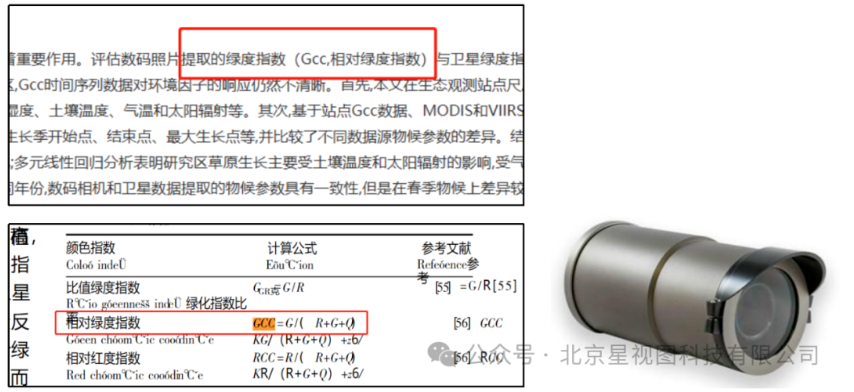
Figure 1.5.1 Wide Band Vegetation Index with RGB Color Camera
Due to the spectral characteristics of green plants (as can be seen from Fig. 1.6.2, the change characteristics of healthy vegetation in the near infrared are significantly stronger than those in the green band), the NDVI normalized vegetation index is able to better respond to the greenness of the vegetation, the photosynthetic potential, and to reflect the metabolic intensity of the vegetation as well as its seasonal and inter-annual variations compared to the indices such as the GCC and the GVI, and so the NDVI is gradually being emphasized in the field of plant research.
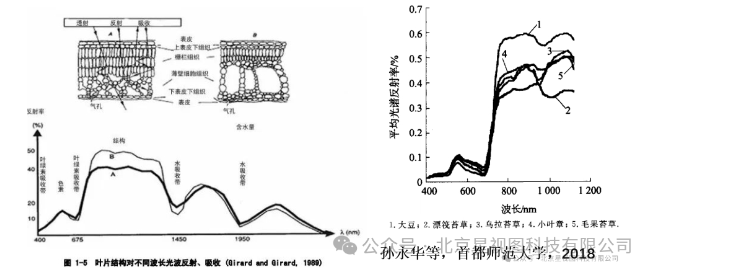
Figure 1.5.2 Spectral properties of green plants
As a result, weather cameras that can calculate NDVI are gradually appearing on the market. Compared with the original RGB camera, there is a great improvement, but at present, the weather cameras that can measure NIR images and calculate NDVI are mostly wide-band weather cameras.
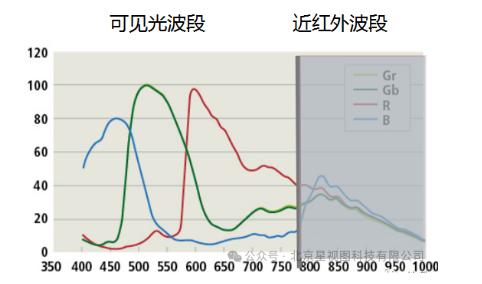
Figure 1.5.3 Spectral curve of the camera sensor's wide-band response
The band "wide" here is compared to the spectral bandwidth of satellite remote sensing data, such as Landsat8 data, the spectral bandwidth in the red and near-infrared bands is 30 nm, while the current wide-band NDVI cameras in the red and near-infrared, usually depends on the response characteristics of the imaging sensors; for example, the range of the response of the red light that can extend from more than 500 nm to more than 700 nm, with a bandwidth close to 200 nm, contains some green and NIR reflections, and is not truly red. Therefore, the wide-band climate camera can only get the vegetation index that is similar to the remote sensing monitoring, which can only be used to make some qualitative judgments, and cannot do the quantitative evaluation of remote sensing climate. In the program of accurate observation of vegetation index, there are also application cases of using spectral camera to observe climate: for example, the Sequoia multi-spectral camera, which has more applications in the observation and research of plant climate (growth rhythm), is originally a spectral camera for drones, and it can obtain the narrow-band spectral images of 660 nm red light and 790 nm near-infrared. However, this type of camera is not suitable for plant climate observation for the following reasons:
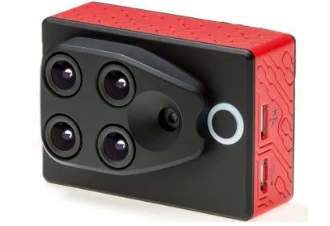
Figure 1.5.4 PARROT SEQUOIA multispectral camera
(1) The use of different scenarios: the camera used by the UAV does not require high tolerance and stability in the field environment, but instead has high requirements for high precision and lightweight, which will lead to its unsuitability for long-term automatic operation in the field.
(2) Different working modes: cameras used by UAVs often do not take into account the support of timed automatic operation, remote data transmission and remote control and other related technologies, so they need to be developed in depth in terms of field applications and have high technical requirements.
(3) Data processing ideas are different: cameras used by UAVs are more focused on spatial data processing, such as image stitching; while physical weather cameras are more focused on time-series data processing, such as synthesizing vegetation index change curves.
(4) Different design concepts: the UAV spectral camera adopts a multi-eye (multi-sensor lens) camera, which is convenient for it to acquire multiple spectral data at the same time while moving; while the weather camera does not move and has a multi-eye design, which is not only costly, but also due to the different positions of each sensor lens of the camera, the field of view is not the same. In the process of UAV use due to the observation distance and almost no effect, but in the weather observation due to the ground set up to cause the distance from the target is relatively close, the field of view deviation will become very obvious, as shown below, which will lead to the later multi-band data in the local processing of the position of the corresponding error.
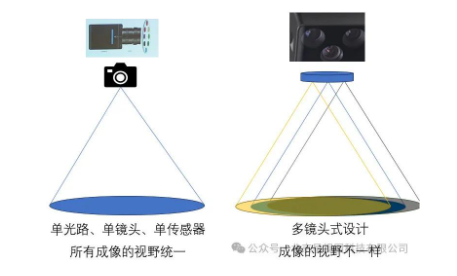
Figure 1.5.5 Schematic diagram of the differences in imaging field of view due to multi-ocular camera
II. Narrow-band spectral weather cameras
In order to solve the above problems, Beijing StarView Technology Co., Ltd. independently developed a monocular narrow-band spectral weather camera.
1,Data acquired by narrow-band spectral cameras
The camera obtains two types of data with each shot:1)Normal RGB color image data, capable of automatically calculating GCC, GVI, and other wide-band vegetation indices.2)Spectral image data in narrow bands (bands can be customized, currently more mature is 650±10nm red and 850±10nm near infrared), and is able to synthesize a hybrid NDVI image, which contains: 650nm spectral grayscale map, 850nm spectral grayscale map and NDVI grayscale map. The NDVI grayscale map is calculated from the DN value of each pixel of the other two maps according to the NDVI formula, and the bright pixels in the map are the ones with high NDVI values, and vice versa.
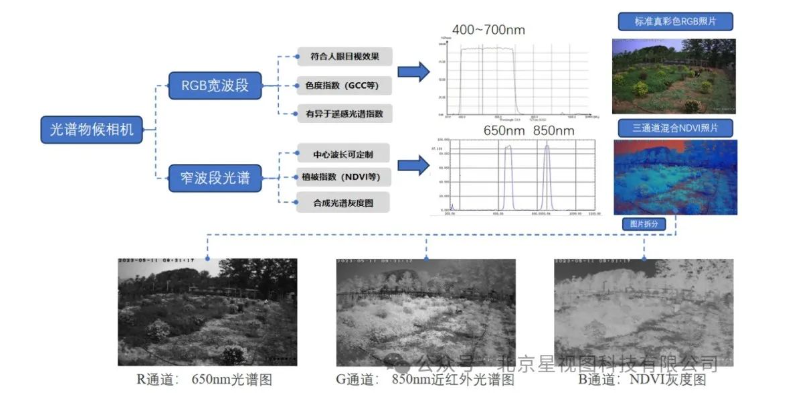
Figure 2.1.1
2,Features of the StarView Spectral Climate Camera
The acquired NDVI values are almost unaffected by shadows, and the NDVI images can well reflect the distribution and growth of vegetation.
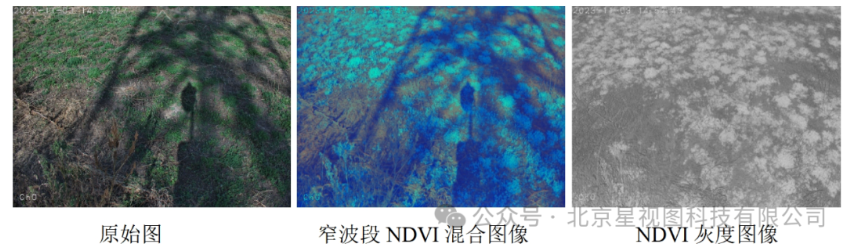
Figure 2.2.1 Simultaneous acquisition of RGB image and NDVI image by Star View Spectral Weather Camera
The NDVI hybrid image was imported into the SmartViewer climatic image processing system software of Beijing StarViewer, which can be split into three gray-scale pictures, namely, the 650 nm spectral gray-scale map, the 850 nm spectral gray-scale map and the NDVI gray-scale map.
There is no more shadow of the tower in the original real scene in the split NDVI gray scale image. It shows that the instrument's calculation of NDVI value is not affected by the change of light intensity in the regular use environment, and the anti-interference ability is very strong. At the same time, due to the design of the monocular camera, the imaging of the two grayscale maps of 650nm and 850nm is completely consistent, so the synthesized NDVI image is also completely consistent with the framing of the original map, which is a real sense of the NDVI distribution image. In terms of the accuracy of the vegetation index, the narrow-band NDVI vegetation index is more stable and precise than the wide-band GCC vegetation index.

Figure 2.2.3 Comparison of data for the broad-band spectral index GCC and the narrow-band synthetic index NDVI
The StarView Spectral Climate Camera has the following characteristics: 1) band consistency: the band settings are fully consistent with those of remote sensing satellites; 2) radiation consistency: through radiation calibration, it can obtain radiation products consistent with remote sensing observations; 3) parameter consistency: the Narrow-band Climate Camera is able to obtain the real meaning of the Neutral Vegetation Index (NDVI), which meets the needs of scientific research. Summary: The introduction of narrow-band spectral imaging technology makes StarView's weather camera a qualitative leap forward with significantly improved performance compared to traditional weather cameras.
Comments are closed